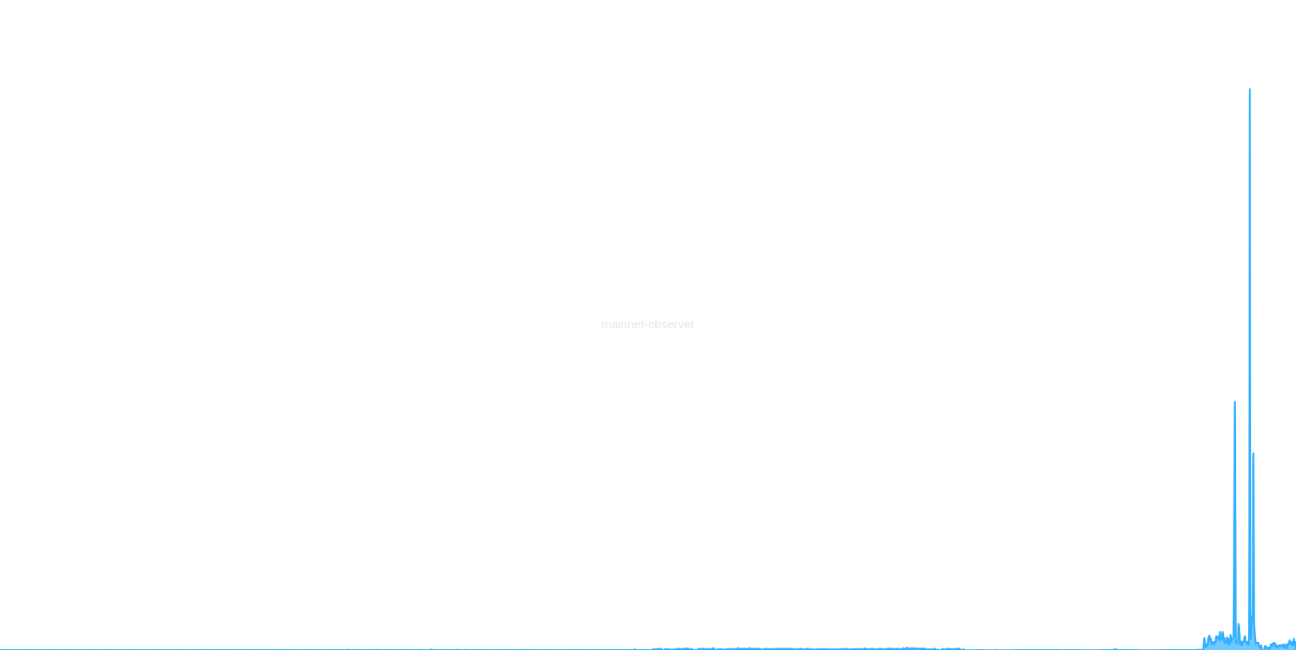
Transaction Fee Rate Distribution
Shows the percentage distribution of daily transactions across different fee rate bands.This stacked area chart displays how transaction fees are distributed as percentages across different fee rate tiers, showing patterns of fee market behavior over time. Each fee rate band shows what percentage of daily transactions fall within that range. The visualization includes zero-fee transactions and highlights the emergence of sub-1 sat/vByte transactions.
Category: Fees | Tags: feerate, fee-bands, distribution, stacked